Tripod Home | New | TriTeca | Work/Money | Politics/Community | Living/Travel | Planet T | Daily Scoop
The Wall Street Journal publishes a summary of investing expenses and performance details for thousands of mutual funds. The expense information appears on Mondays, and the performance information, measuring the return on your investment and providing a sense of how each fund is doing in relation to other, similar funds, appears Tuesday through Friday.

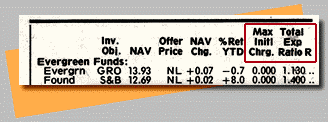
On Monday, The Wall Street Journal takes a specific look at what various funds cost and ranks them in relation to other funds with the same objective.
The maximum initial charge is the percentage of a share's price the fund charges as a load, or commission. If an "NL" appears in the column, it's a no-load fund and there's no up-front charge.
The total expense ratio is the percentage of the total fund assets paid as fees, including loads and all other charges. It can be as high as the current limit of 8.5 percent or as less as one percent.

On Tuesday, the total return column reports performance for the last month and the last year.
The one-year figure is useful for comparing a fund's performance to the standard investment benchmarks, like the S&P; 500 or the Dow Jones Industrial Average, and to other funds with similar investment objectives. If your fund and other similar funds are up or down by about the same percentage over the last year, it suggests that the fund managers are making similar decisions or facing the same kinds of problems. But if your fund's performance is lagging seriously, you may want to to assess the investment.

On Wednesday, the figures report total return for the last quarter and over the last three years.
The three-year return figures - and those for four and five years that appear late in the week - are annualized. That means that the total return for a multi-year period is divided by the number of years it covers to give the average return for the period in question. The actual return for each of those years might be different from the annualized number, more accurately accounting for swings in the fund's performance.

On Thursday, you can look at a fund's figures for the last six months (26 weeks) and the last four years.
The A to E ranking of each fund that appears in the last column under Total Return may be different on different days of the week - C on Wednesday and E on Thursday, for example. That's because a fund's four-year performance might be different than its one-year performance. Many experts advise that funds that hold up under long-term comparison are better bets than those that do brilliantly one year but not so hot in others.

Mutual funds analysts are especially interested in the five-year figures because they measure a fund's durability.
On Friday, a lot of NS's appear in the five-year column, with nothing in the ranking column. That's because of the recent growth spurt in mutual funds. Lots of the current ones weren't around five years ago, so there are no figures. In contrast, there are a number that have been going strong for a quarter-century or more.
Map | Search | Help | Send Us Comments